Over this unit we learned a lot about earthquakes now we are learning about how, if we ever find ourselves in one, we can keep ourselves safe in one. If you find yourself in an earthquake some steps you should follow include:
If you are inside the house you must drop, cover and hold. Meaning take cover under something sturdy like a table or desk. Hold onto the legs for stability and keep your head down.
Avoid taking cover near heavy object, mirrors or windows because these things could potentially fall and shatter.
If you are cooking quickly switch off the stove to prevent a fire and take cover.
If you are outdoors move to an open area where things are not able to fall on you, away from power lines, trees and buildings.
If an earthquake ever hits while you are driving make sure to pull over smoothly. Avoid bridges and overpasses and other heavier objects. Stay in car.
What should you do after an earthquake?
Check and attend to injuries and ensure the safety of people around you.
Check for damage and if your building is badly damaged then leave immediately.
If you smell or hear a gas leak leave and open all the windows and doors.
What can you do to prepare for an earthquake:
Learn the drop, cover and hold.
Teach all the members of your family about earthquake safety.
Stock up on emergency supplies. These include: battery operated radio (and extra batteries), flashlights (and extra batteries), first aid kit, bottled water, two weeks food and medical supplies, blankets, cooking fuel, tools needed to turn off your gas, water and electric utilities.
Arrange your home for safety I will show you how I altered my house later on.
Store flammable liquids somewhere safe.
Learn where the main turn-offs for energy are in your house.
So I looked through the ground floor of my house and decided what I could change:
If an earthquake strikes there would be no where for anyone to drop, cover and hold. So either we would have to buy sturdier tables that we would be able to take cover under. If we weren't able to purchase tables we could find safety underneath our door frames.
There are multiple glass doors in my house so when finding a place to take cover we would have to watch for flying glass.
I am not sure but I think that all the shelves we have are not attached to the wall with brackets so I think to make our house safer we would have to add brackets to all the shelves so that they would not topple and crush anyone.
Another bad thing in my house is the windows because they could break and the flying glass could easily hurt someone trying to take cover or running by.
ONE WORLD TSUNAMI ESSAY Maria Los, 2/25/11, Science
When a wave of 100 feet comes crashing down upon a city it does not leave a small imprint. A tsunami is a sequel of waves in the ocean that make surges of water come crashing down onto land. Sometimes these waves can be so powerful they reach heights of up to 100 feet, which is scary when you think about the fact that some blue whales can reach about 100 feet in length.
Evidently, something this immense and powerful can cause major and widespread destruction on shore. Yet is a tsunami as fast as it is immense? Well a tsunami will zoom across the sea at 500 miles/805 kilometers per hour; this is about as fast as a jet plane. Another scary fact is that a tsunami can cross an area as large as the Pacific Ocean in less than a day and considering their long wavelengths it means they lose very little power and energy along the way. So how are these frightening waves caused?
Cause of Tsunamis
Just like on land, underwater there are earthquakes, yet unlike on land when an earthquake takes place underwater the ocean floor’s plate rises and falls so much until it eventually displaces the water causing it to flip up and make a rolling wave which then becomes a turns into a tsunami.
Or a subduction zone can cause a tsunami; this happens when an oceanic tectonic plate is being forced down into the mantle by tectonic plate forces, this then creates a subduction zone. The friction between the plates is plentiful and creates it hard for them to move and they then become stuck.
A tsunami can also be caused by accumulated seismic energy. When a plate starts to descend into the earth’s mantle it can cause the plate on top to become slowly distorted, then the energy that has become accumulated is a lot like a spring. This can accumulate over a period of time, decades or even centuries.
Last but not least, a tsunami can be caused when waves race away from an epicenter. As it races away some of the water ends up travelling out and across the basin of the ocean and, simultaneously, water rushes towards land to flood recently lowered shorelines.
How a tsunami works
Even though it all looks like one fluid motion, an actual tsunami has three quite distinct stages that overlap. As we talked about before, the formation of the tsunami is caused by a force that disturbs the water column (which is the section of water from the surface to the sea floor). The displaced water then starts to extend away from the generation, site which is called propagation. So when a tsunami is initiated, the waves will extend in all directions across deeper ocean as I mentioned before, not only do these waves travel at great speeds but they also have very long wavelengths. Then inundation occurs which means the waves spilling onto normally dry land. Like a chameleon, a tsunami will sometimes change because of its surroundings. For example, as a tsunami travels into shallow water shoaling may occur. Shoaling is when the amplitude increases in a wave. Of course, shoaling does not always occur in every type of environment, mostly in a harbor, bay or lagoon. These were the steps more or less how a tsunami makes its journey to the shore, so what happens after it has reached land? When a tsunami reaches the shore a few things can happen. A drawdown can occur, in which the levels of the ocean to the shoreline drop exposing the floor of the ocean. The cause of this is when the trough of the wave reaches the shore earlier than the crest of the wave.The drawdown can vary in length but it really depends on the wave length. As I mentioned before, Inundation can occur, the speed will reduce, but the wavelength will do the opposite, increase! This means making the wave even taller than before. Another thing that may occur when a tsunami reaches the shore is that extremely dangerous rips and currents can be found. These happen mostly during the smaller tsunamis and can be hazardous to anyone swimming in the water.
Ring of Fire
An interesting fact is that about 80% of tsunami occurs in the ring of fire. Yet what is the ring of fire? From New Zealand, travelling the length of the eastern edge of Asia, north across the Aleutian Islands of Alaska and south along the coast of North and South America, the ring of fire is a arc that is made up of over 75% of the worlds active and dormant volcanoes. Before any theory of plate tectonics the ring of fire was noticed. Now though we know that it is placed on the borders of the Pacific Plate and other major tectonic plates. Other than just hosting volcanoes it also hosts many tsunamis. According to the NOAA Center for Tsunami Research the last earthquake that occurred in the ring of fire was located near the Bonin Islands, Japan. The tsunami struck on December 21, 2010, during 2:20 A.M on a Wednesday. At a magnitude of 7.4, the JMA (Japan Meteorological Agency) was alerted and issued a warning. There were no reports right away about damage or casualties, but tsunami advisory was given to surrounding islands.
Predicting Tsunamis
When the tsunamis are in deep ocean, they can only appear a foot or so high so they don’t seem as harmful as they actually are when they approach the shore and have reached their full height. This is why, if you tried to predict a tsunami by just looking at the water, it would be very hard. This is also why scientists and researchers have come up with different devices to try and predict tsunamis.
Buoy System
This system is one of the two kinds of instruments which the Bureau of Meteorology uses to verify the existence of tsunamis made by underwater earthquakes. They monitor and then record the changes in the oceans sea level. Two parts make up a tsunami detection buoy, a pressure sensor that is attached to the bottom of the sea. Its purpose is to measure changes in the water’s height, and the surface buoy. The surface buoy takes the information recorded by the sensor and sends it to a satellite to a tsunami warning center. The buoy includes two modes; these include “standard” and “event”. Standard is the normal mode in which the buoy simply collects and sends information every 15 minutes. The event mode is used when the buoy first senses faster moving seismic waves, it starts to send out information more frequently, every minute. These buoys are located in areas that are far enough away from actual potential earthquake epicenter area, so that there is no interference. Yet the buoy still needs to be close enough to some kind of epicenter to pick up the warnings in time.
Animal Infrasound
During a natural disaster infrasonic waves travel through the earth, and animals have been known to be able to detect these waves. If this is seen, animals can be used as an early warning for tsunamis or other natural disasters. One example is that of the 2004 earthquake and tsunami in the Indian Ocean. Animals were said to be seen fleeing the area prior to the actual tsunami tearing apart the shore. We are not yet sure what causes the animals to flee, but it is believed to have something to do with electromagnetic waves and maybe not infrasonic waves that cause these animals to run away
GITEWS
GITEWS stands for German-Indonesian Tsunami Early Warning System and it includes a combination of different sensors, whose main focus is to detect quickly and precisely and analyze earthquakes. It is all supported by GPS measurements. Seismometers, GPS stations, tide gauges and buoy systems, make up this system. Yet this method has its limitations. This is because when a quake which caused a tsunami to run over the top of the Pagai Islands in the Sunda Arc at the exact time the warning reached the region. Even with its flaws this system is being called efficient and functional.
Warning Systems
After the tsunami has been predicted or detected there is a great deal to do. The populations in the affected areas all have to be warned and told to evacuate. There are a variety of waves the warnings can travel to population. Through SMS, E-Mail, Fax, Radio, telex and sirens also can be used. Two types of warning systems are usually used though Regional and International Warnings systems. The difference between the two is that, an International Warning System uses data from Pacific Ocean, Indian Ocean, North Eastern Atlantic, the Mediterranean and connected seas, and the Caribbean to predict a tsunami, while the Regional warning system uses seismic data from nearby earthquakes to determine if a threat to the area is possible. Both of these systems can help the warning across quickly. This is particularly true if the warning system is in advance, thus allowing citizens to evacuate and reduces the amounts of lives lost. Of course with warning systems there are always some people who are not reached or who ignore the warning. As a consequence from my point of view, sirens are better warning systems because they are heard by everyone and can’t really be disputed. Those who choose not to believe the predictions and warnings that are made can have an understandable argument, because, from time to time false tsunami warnings have been given. Still the “Better Safe than Sorry” policy seems to prevail.
Safety Tips in a Tsunami
“Oh-no, you have just heard the siren that warns you about a tsunami! What do you do? Run? Hide?” No, just take three deep breaths, clear your head and follow the rules:
·Plan you evacuation route. This route should take you to a higher ground.
·Do not stay near the shore.
·Do not go back until you have been told by authorities that it is safe to do so.
·Closely monitor a radio for any new information.
·If you have an emergency kit, take it with you.
·Find your electric and gas service mains and turn them off. Yet, if you do not have to time to do so, skip this step.
·Do not communicate on the phone unless an immediate, valid emergency.
Do you want to learn how to be prepared for when a tsunami strikes? Learn it below:
·Fill a backpack with emergency supplies and keep it somewhere easily accessible.
·Learn the basic first-aid instructions.
·Learn the location of the nearest safe area or location.
·Find the utility mains and learn how to switch them off.
·Have an evacuation plan ready.
Effects of Tsunamis
One of the most disturbing natural disasters known to man is probably the tsunami. It’s easy to imagine their terrifying power because with several tons of water creeping above you any normal person would be scared. To me what is particularly frightening, is the fact that not only can it sweep you away but it can also rip up buildings, even the well built ones. So, truly nowhere (unless it is very high ground) is safe. The saddest part though about a tsunami is all the lives that are lost. One very sad example is that of the 2004 tsunami in the Indian Ocean. It was a 9.2 earthquake in Sumatra off the coast of Indonesia that created the disturbance which became this tsunami. The death toll was an estimated 300,000-350,000. That tsunami resulted in the most loss of life due to a natural disaster, in modern history. Some people think that the instantaneous destruction is the only problem. Yet there is so much more than that. The risk of disease increases as there is contaminated water everywhere. Also the destruction a tsunami causes creates flooding, people to lose their homes and family, and much more.
To sum up my essay here is a video about tsunamis with some shocking footage:
"Deep Ocean Tsunami Detection Buoys." Bureau of Meteorology - Home Page. N.p., n.d. Web. 24 Feb. 2011. .
Hill, Joshua. "Tsunami Detection System in Place – Planetsave.com: climate change and environmental news." Planetsave.com: climate change and environmental news. N.p., 29 Dec. 2010. Web. 24 Feb. 2011. .
"How do tsunami work?." Beach Safety: Beachsafe is an online beach safety portal for all Australians and visitors.. N.p., n.d. Web. 24 Feb. 2011. .
"Infrasound - Wikipedia, the free encyclopedia." Wikipedia, the free encyclopedia. N.p., n.d. Web. 24 Feb. 2011. .
"NOAA Center for Tsunami Research - Events." NOAA Center for Tsunami Research. N.p., n.d. Web. 24 Feb. 2011. .
National Weather Service. "Tsunami Safety Advice." Tsunami Safety Advice. West Coast & Alaska Tsunami Warning Center, n.d. Web. 24 Feb. 2011. .
Rosenberg, Matt. "Ring of Fire - Pacific Ring of Fire." Geography Home Page - Geography at About.com. The New York Time Company, 1 Feb. 2011. Web. 24 Feb. 2011. .
"Tsunami Facts, Tsunami Information, Tsunami Videos, Tsunami Photos - National Geographic." Environment Facts, Environment Science, Global Warming, Natural Disasters, Ecosystems, Green Living - National Geographic. N.p., n.d. Web. 24 Feb. 2011. .
"Tsunami Safety Tips, Tsunami Preparation, Tsunami Readiness - National Geographic." Environment Facts, Environment Science, Global Warming, Natural Disasters, Ecosystems, Green Living - National Geographic. Natural Geographic, n.d. Web. 24 Feb. 2011. .
"Tsunami warning system - Wikipedia, the free encyclopedia." Wikipedia, the free encyclopedia. Wikipedia, n.d. Web. 24 Feb. 2011. .
Seismograph Lab Guiding Question: Does adding to more chopstick for stability improve the readings on the seismograph? Hypothesis: I think that the reading will be better because the pen is more stable and will catch even the slightest bump. Materials:
one 17-inch marker
four 23-inch wooden chopsticks
2 average bendy straws
two 4 cm (in height) boxes
One 30 by 42 cm piece of cardboard
Duct Tape
A Ruler
Paper
Tape
A notebook and pencil
Procedure:
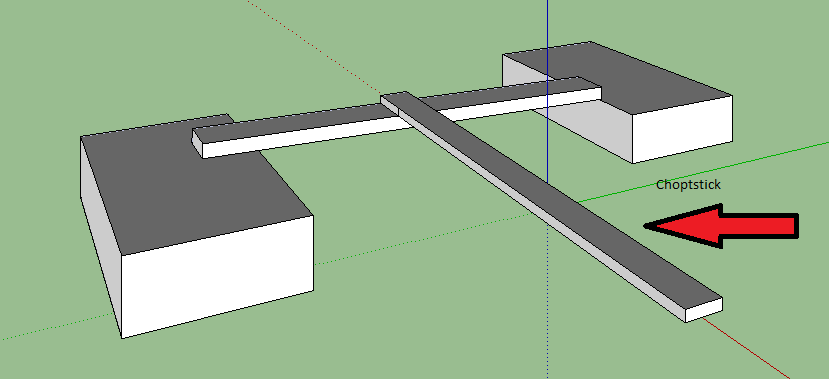
Place the two 4cm boxes about apart, you must then place one chopstick on the top so it spreads across the the two boxes like a bridge. Se Figure A below as an example:
Figure A:
2. Then place the end of a single chopstick on the horizontal chopstick. See Figure B as an example:
3. After you have done this you can add the two straws to the sides by attaching them to the corners of the boxes and then turning them diagonally towards the center chopstick and attaching them there. See Figure C for example: 4. You are now ready to add the felt tip marker, make sure to use a felt tip because it will transfer easier onto the paper. Simply duct tape the pen onto the ends of all the straws and chopstick. See Figure D for an example: 5. Then for the first test tape multiple sheets of paper together to make a long strip. Place this strip of paper at the beginning and have a partner shake the table while you move the sheet slowly. This will leave an almost zig-zag line on the paper. If you want to see how I did it go to the bottom of this post for a video.
6. After you have done that repeat the same thing except you must add two more chopsticks to make the whole structure more stable this is how we will test the stability. To see where to place the chopsticks look at Figure E: 7. After you have recorded both tries you can now compare see which test was straighter and easier to read. Below are these pictures of the tests: The yellow paper is the test with a stable seismograph and the white paper is the test with the unstable seismograph.
b<----- Same as above
C. Analysis of Data: According to the information I got when I compared the two tests I found that the stabler the seismograph the better it works. As you can see in the tests the one that was tested with the more stable seismograph was in a straighter line and didn’t move around as much, making less streaks on the page. As you can see on the drawing with the less stable seismograph it goes of the page and there are random blue streaks where it slipped from it’s place. IV. Concept Acquisition (CONCLUSION): So does the seismograph without the stabilizing chopsticks work better that the seismograph without? According to my research the seismograph with the stabilizing chopsticks worked much better than the seismograph without ones. This is because it didn’t move around as much so the results were clearer and easier to read. I can conclude that a stable seismograph is much better (and works much better) then a non stable one. This means that my prediction was correct, I thought that the prediction I made would make sense because stable to me works much better then unstable. V. Concept Application (FURTHER INQUIRY): I think I carried out this test quite well because my seismograph was built quite quickly and the tests were done quite quickly to. One problem I had was how to shake the seismograph because sometimes when I shook the seismograph it made the pattern go in a loop and not straight up and down, so this created a problem for me. To solve this I tried shaking the seismograph by holding onto the two smaller boxes, balancing the weight equally. Other than that nothing really went wrong on my testing. To further investigate this I could see if weight effects the seismograph when you build it.
Maria Los 21/02/2011 Finding the Epicenter Lab Science 7A Guiding Question: How can we locate an earthquakes epicenter? Hypothesis: I think that you use measurements in some way to figure out the epicenter. Materials: • drawing compass with pencil • outline map of United States
Procedure: 1. Make a copy of the data table below. 2. Using the graph below find the difference in the arrival times. Then enter this difference into the data table. To do this you must look at the difference between the P and S arrival time. Find this time on the graph and follow it on the line until you reach the curve of the line. 3. Using the scale on your map set the compass so that it is in cm on the map what it would be in km in the real geographical area. Make sure the sharp end is where the “point” is. 4. Now draw a circle with a radius that was discovered in step 4. Do this for all the countries. Here is an example below of what it should look like.
ANALYZING: 1. Measuring: I located the epicenter to be in Nashville, Tennessee. The closest city to the epicenter is Illinois, Chicago. In kilometers this city from the epicenter is 700 kilometers on the map that I used. 2. Inferring: In order of which cities felt the earthquakes would go like this Chicago, Illinois then Houston, Texas and last but not least Denver, Colorado. 3. Estimating: San Fransisco is around 2,800 kilometers away from the epicenter. If it is around 2,800 kilometers we can tell, using our graph, the difference between the P and S waves. With my graph I figured that the difference between the two waves should be about 2 min 20s. 4. Interpreting: As the distance from the earthquake increases the distance between the P and S waves actually decreases. You can see this when you look at the graph with all the points. 5. Communicating: When you are trying to locate an epicenter it in necessary to know the distance from at least three recording stations because then you have a sufficient amount of information from different sources.
CONCLUSION: 1. So to conclude, the earthquakes epicenter is located somewhere around Nashville, Tennessee. To figure this out I had to find the distance to the epicenter using a graph and the time between P and S waves. Using the distances that I found I used my map to locate exactly where the epicenter should be. This lab taught me how to figure out the epicenter and understand the effects of an earthquake and how they travel.